What Is Algorithmic Trading and How Does It Work? A Beginner's Guide
Algorithmic trading once lived exclusively inside the trading desks of investment banks and quantitative hedge funds. Today it sits at the center of modern capital markets, accounting for the majority of volume on major exchanges. Yet for many newcomers the term still sounds like a black box of code and equations. This guide explains, in clear language, what algorithmic trading is, how it works step by step, and why systematic execution has become the operational standard for professional capital allocation. Throughout, we anchor the concepts in real, verified performance data from the PMTS (Professional Modular Trading System) program, updated as of June 14, 2026.
What Is Algorithmic Trading?
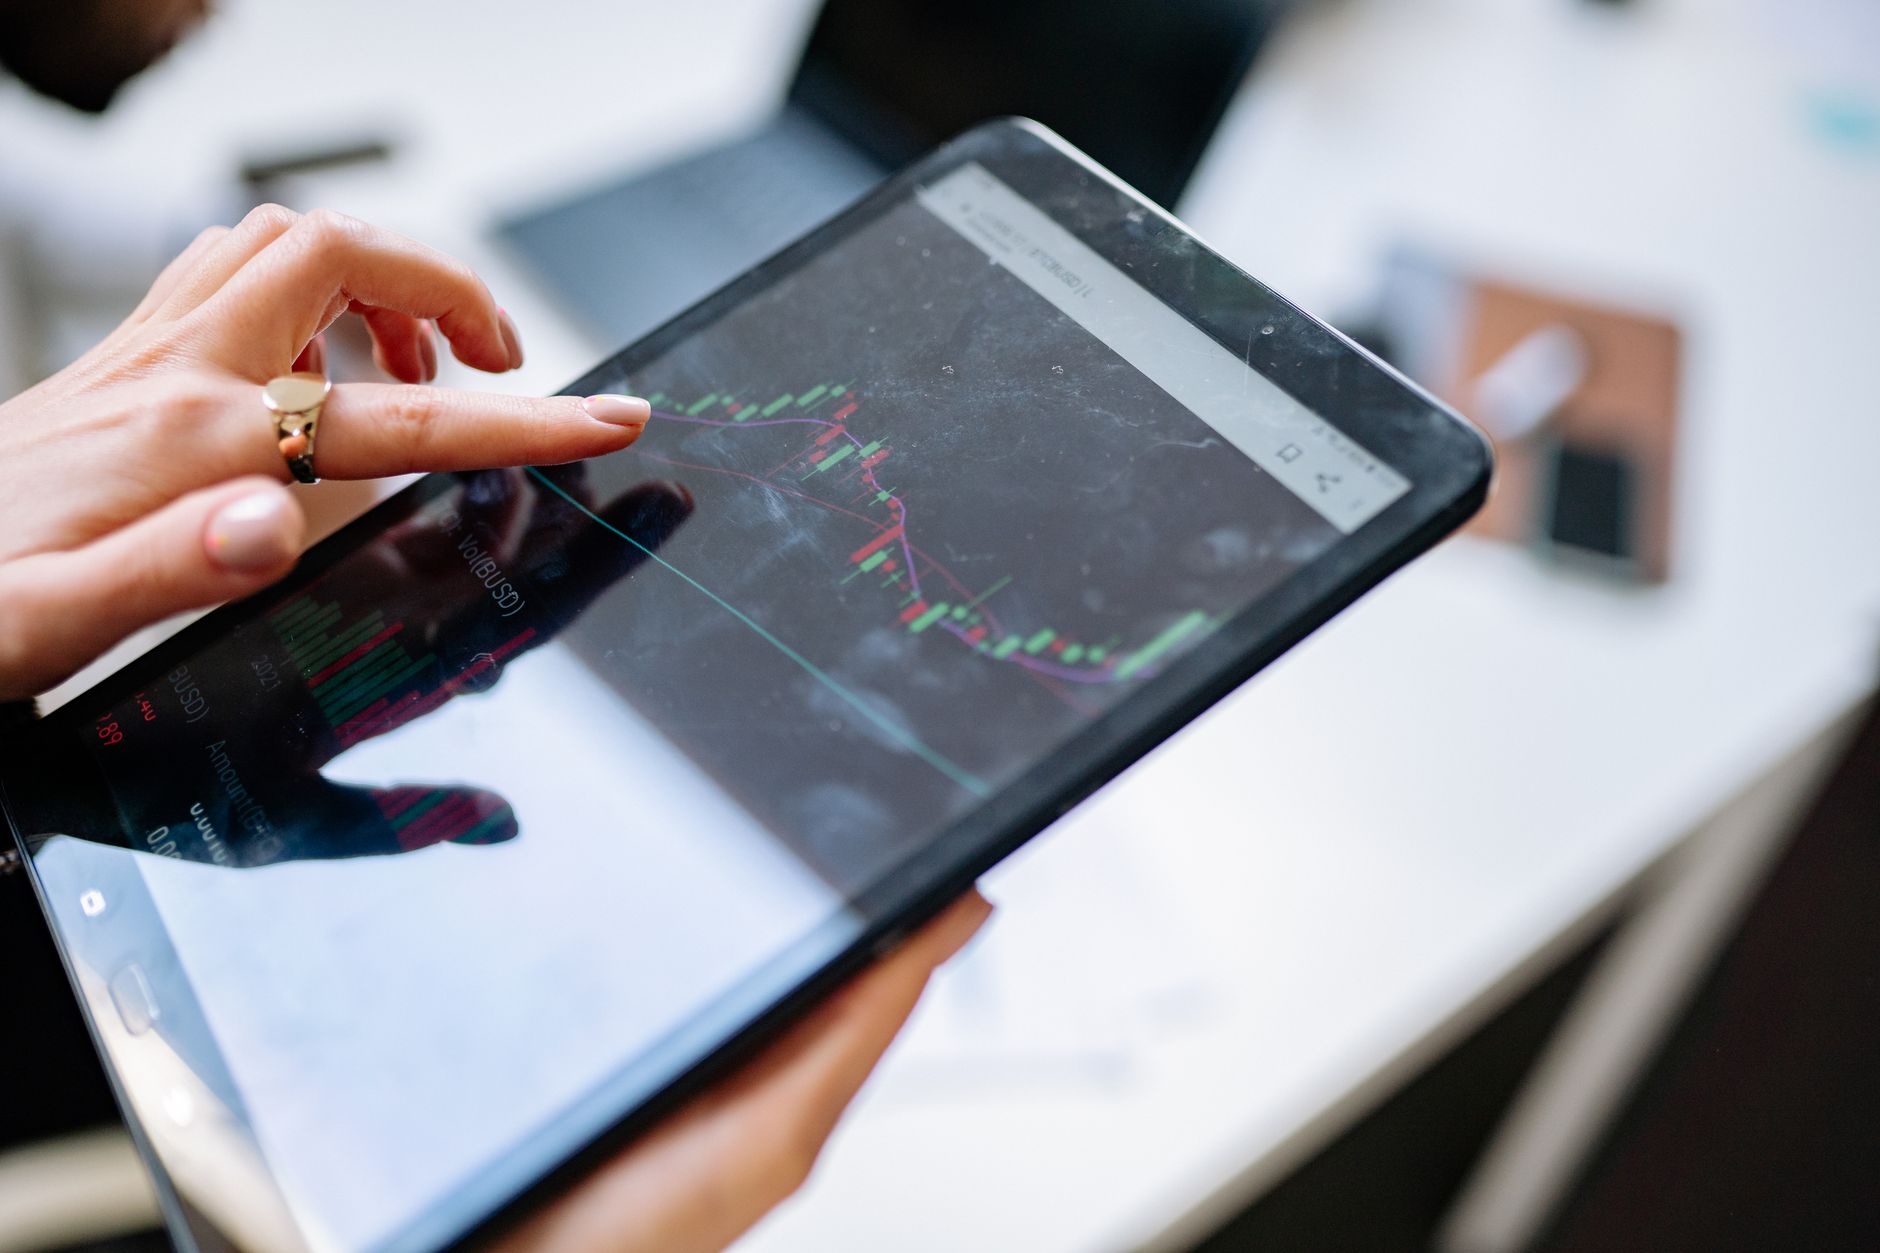
Algorithmic trading is the use of a computer program to execute trades according to a predefined set of rules. Instead of a human deciding — emotionally, and often inconsistently — when to buy or sell, the algorithm evaluates market data and acts automatically the moment its conditions are met. Those rules can be simple, such as "buy when the price crosses above a moving average," or highly complex, combining dozens of statistical signals, volatility filters, and risk constraints.
The defining characteristic is not speed but discipline. A well-built algorithm follows the same logic on the thousandth trade as it did on the first. It does not grow greedy after a winning streak, nor fearful after a loss. This consistency is precisely what most discretionary human traders struggle to maintain.
Algorithmic vs. High-Frequency Trading
A common misconception is that algorithmic trading and high-frequency trading (HFT) are the same thing. They are not. HFT is a narrow subset focused on executing thousands of orders in microseconds to capture tiny price discrepancies. Most institutional algorithmic strategies — including PMTS — operate on far longer timeframes, holding positions for minutes, hours, or days, and competing on quality of decision rather than raw latency.
How Algorithmic Trading Works: Step by Step
Every systematic trading program, regardless of asset class, follows the same fundamental pipeline:
- Data ingestion. The system continuously receives market data — price, volume, spread, and often macroeconomic indicators. PMTS, for example, streams live tick data directly from MetaTrader 5 (MT5), the institutional execution platform.
- Signal generation. The algorithm analyzes that data through its model and produces a signal: buy, sell, or stay flat. This is the strategic core, where statistical edge lives.
- Risk filtering. Before any order is sent, the signal passes through risk constraints — position size, maximum exposure, volatility limits, and correlation checks. A signal that violates risk rules is rejected, no matter how attractive it looks.
- Execution. Approved orders are routed to the broker automatically, with stop-loss and take-profit levels attached.
- Monitoring and feedback. Open positions are tracked in real time, and every closed trade is recorded for performance analysis.
You can see this exact pipeline reflected in the live PMTS dashboard, where every trade, equity change, and risk metric is logged transparently. Explore the live performance dashboard to see how a systematic record is built trade by trade.
A Concrete Example: One Trade From Start to Finish
To make the pipeline tangible, imagine a single XAUUSD trade. The system ingests a stream of MT5 tick data and detects that price momentum, volatility, and a macro filter all align in the same direction ahead of a quiet session. The model issues a buy signal. Before execution, the risk layer checks the proposed position against the account's exposure limit and confirms the trade risks only a small, fixed fraction of equity — exactly the discipline that keeps the maximum drawdown at 0.41%. The order is sent with a predefined stop-loss and take-profit. Minutes later the take-profit is hit, the position closes, and the result is logged to the dashboard. No hesitation, no second-guessing, no revenge trade after the rare loss. Multiply this disciplined loop across 50 trades and you arrive at the 86.00% win rate and 5.87 profit factor cited above.
Why Rules Beat Emotions: The Data
The theoretical case for algorithmic trading is discipline. The practical case is measurable performance. Consider the verified statistics from the PMTS reference account as of June 14, 2026:
- Win rate: 86.00% — 43 of 50 closed trades were profitable.
- Profit factor: 5.87 — the system generated $5.87 in gross profit for every $1.00 of gross loss.
- Sharpe ratio: 10.23 — an exceptionally high measure of risk-adjusted return.
- Maximum drawdown: 0.41% — the largest peak-to-trough decline in account equity.
- Total return: 9.53%, growing the reference equity to $54,762.81.
Two numbers deserve emphasis for beginners. The first is the profit factor of 5.87. A profit factor above 1.0 means a strategy is net profitable; institutional desks often consider anything above 2.0 strong. The second is the maximum drawdown of just 0.41%, which speaks to disciplined risk control — the system protects capital aggressively rather than chasing oversized returns.
It is worth being clear about what these figures do and do not represent. They are the result of a specific period under specific market conditions, including the volatility around recent FOMC meetings and Fed policy decisions. They are not a promise of future outcomes.
Understanding the Metrics
For those new to performance analysis, here is what the core ratios actually measure:
- Sharpe ratio measures return per unit of total volatility. Higher is better; it rewards consistency.
- Sortino ratio refines the Sharpe by penalizing only downside volatility, recognizing that upside swings are not a "risk."
- Calmar ratio compares return against maximum drawdown, rewarding strategies that achieve growth without deep equity declines.
A robust evaluation never relies on a single number. Win rate alone can mislead — a strategy can win often but lose catastrophically on the rare loss. That is why profit factor, drawdown, and the Sharpe, Sortino, and Calmar ratios are read together.
Which Markets Do Algorithms Trade?
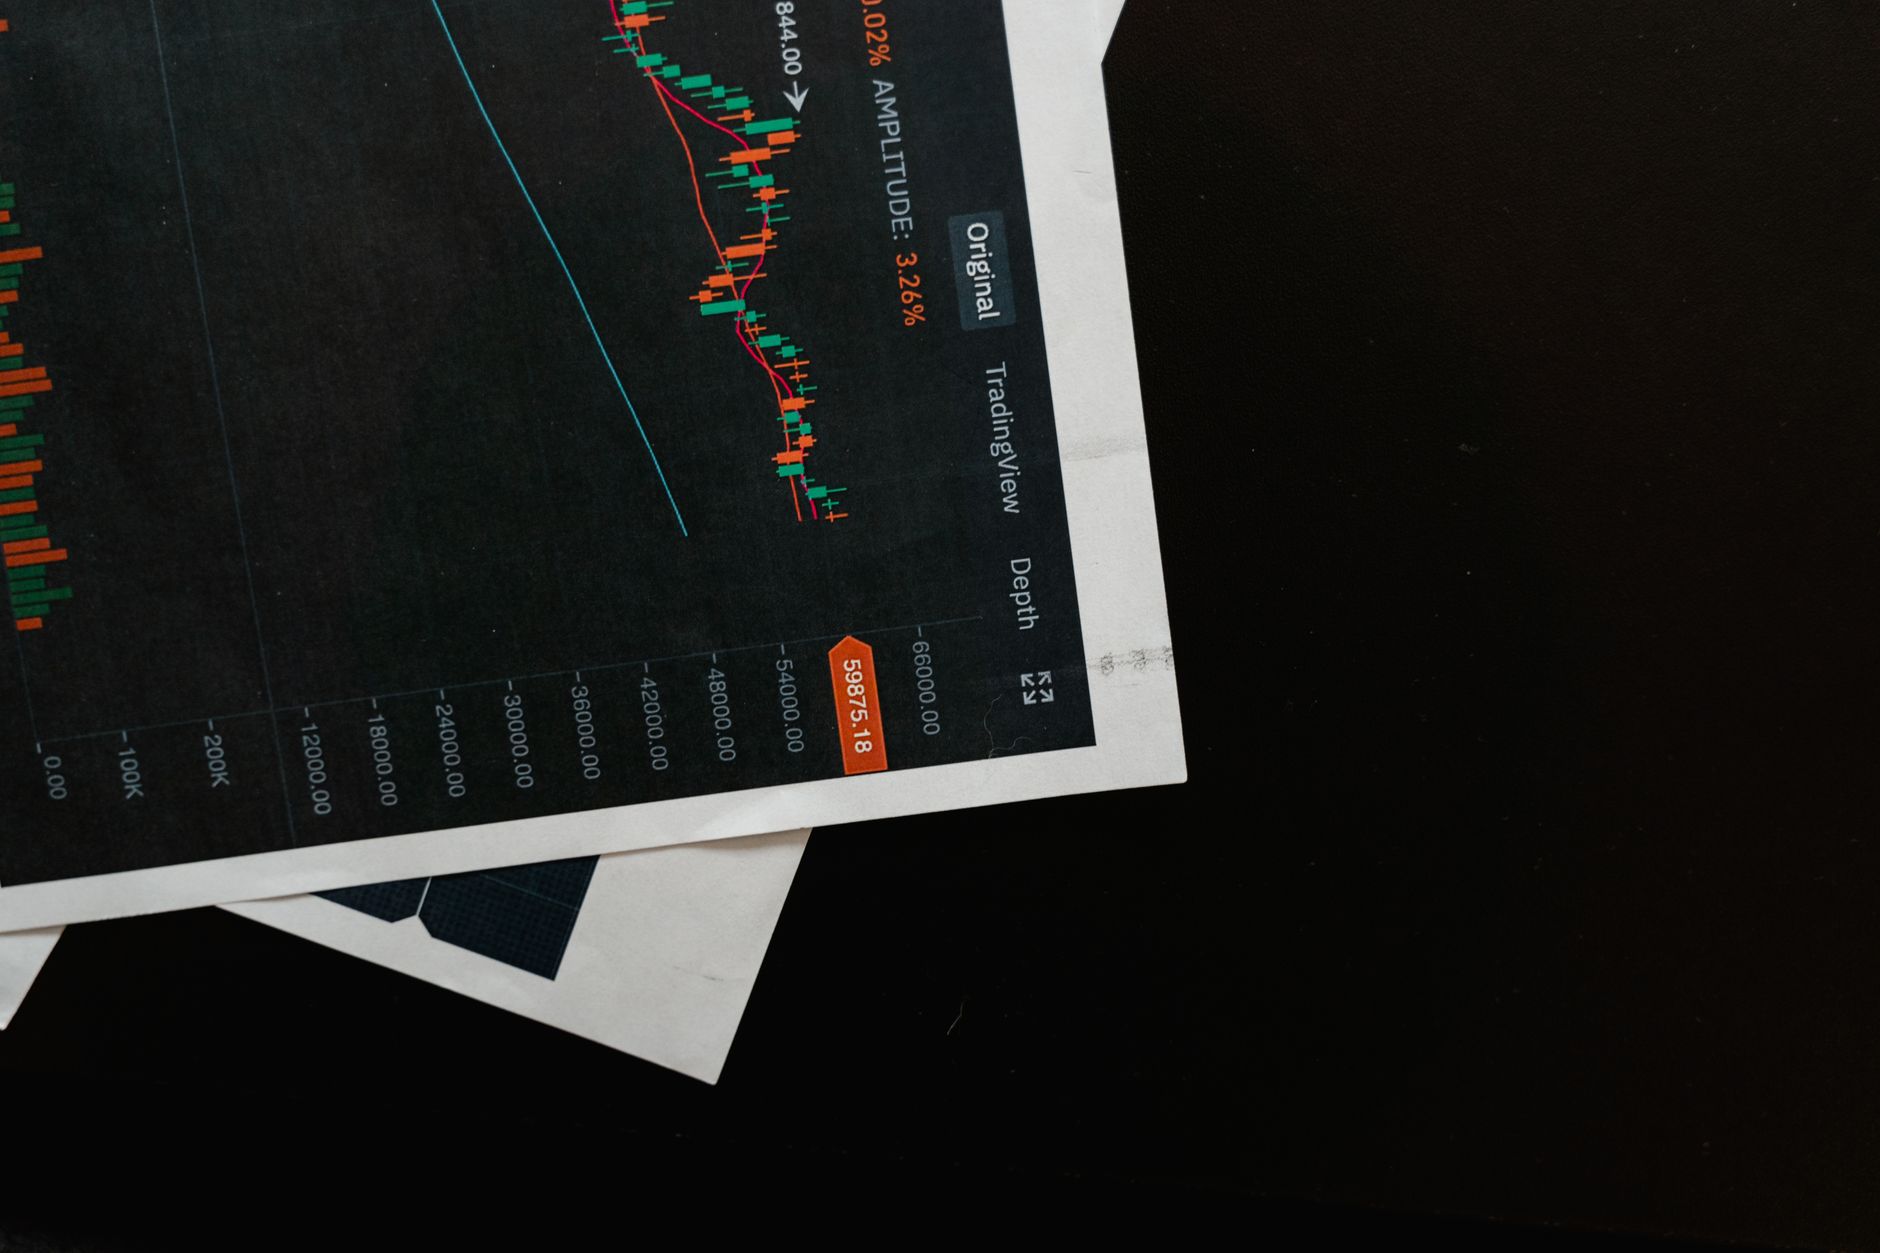
Algorithmic strategies operate across equities, futures, foreign exchange, and commodities. PMTS focuses primarily on gold (XAUUSD), one of the most liquid and widely traded instruments in the world. Gold is attractive for systematic strategies because it offers deep liquidity, strong reaction to macroeconomic catalysts such as Fed rate decisions, and clean technical behavior that quantitative models can exploit.
The Advantages — and the Honest Limitations
Algorithmic trading offers real structural advantages: it removes emotion, executes faster than any human, operates continuously without fatigue, and produces a complete, auditable record of every decision. That transparency is itself a form of investor protection.
But it is not magic. Algorithms can underperform when market conditions shift away from the patterns they were designed around. They require rigorous validation — backtesting against historical data and, crucially, verification against live results. A strategy that looks brilliant on paper but has never traded real capital should be treated with caution. This is why PMTS publishes live, not simulated, performance.
Getting Started
For an investor, participating in algorithmic trading no longer requires writing code or building infrastructure. Managed systematic programs handle the data, the models, and the execution, while giving you transparent visibility into results. The right starting point is education: understand the strategy, study the verified track record, and assess whether the risk profile matches your objectives.
If you want to follow a live systematic program in real time, you can create a free account and review the full, transparent performance record for yourself.
Past performance does not guarantee future results. Trading involves substantial risk of loss and is not suitable for every investor. The statistics cited reflect a specific account over a specific period and should not be interpreted as a forecast. Nothing in this article constitutes investment advice.
Ready to start trading with AI?
Join hundreds of traders using PMTS algorithmic trading technology
Get Started